
- info@service.digitalmarketingvidyapeeth.com
support@service.digitalmarketingvidyapeeth.com - Pioneer Residential Campus for NDA, Near Khandoba Temple, Raywadi road, Loni Kalbhor, Maharashtra 412201

Blog Details
24
Jun
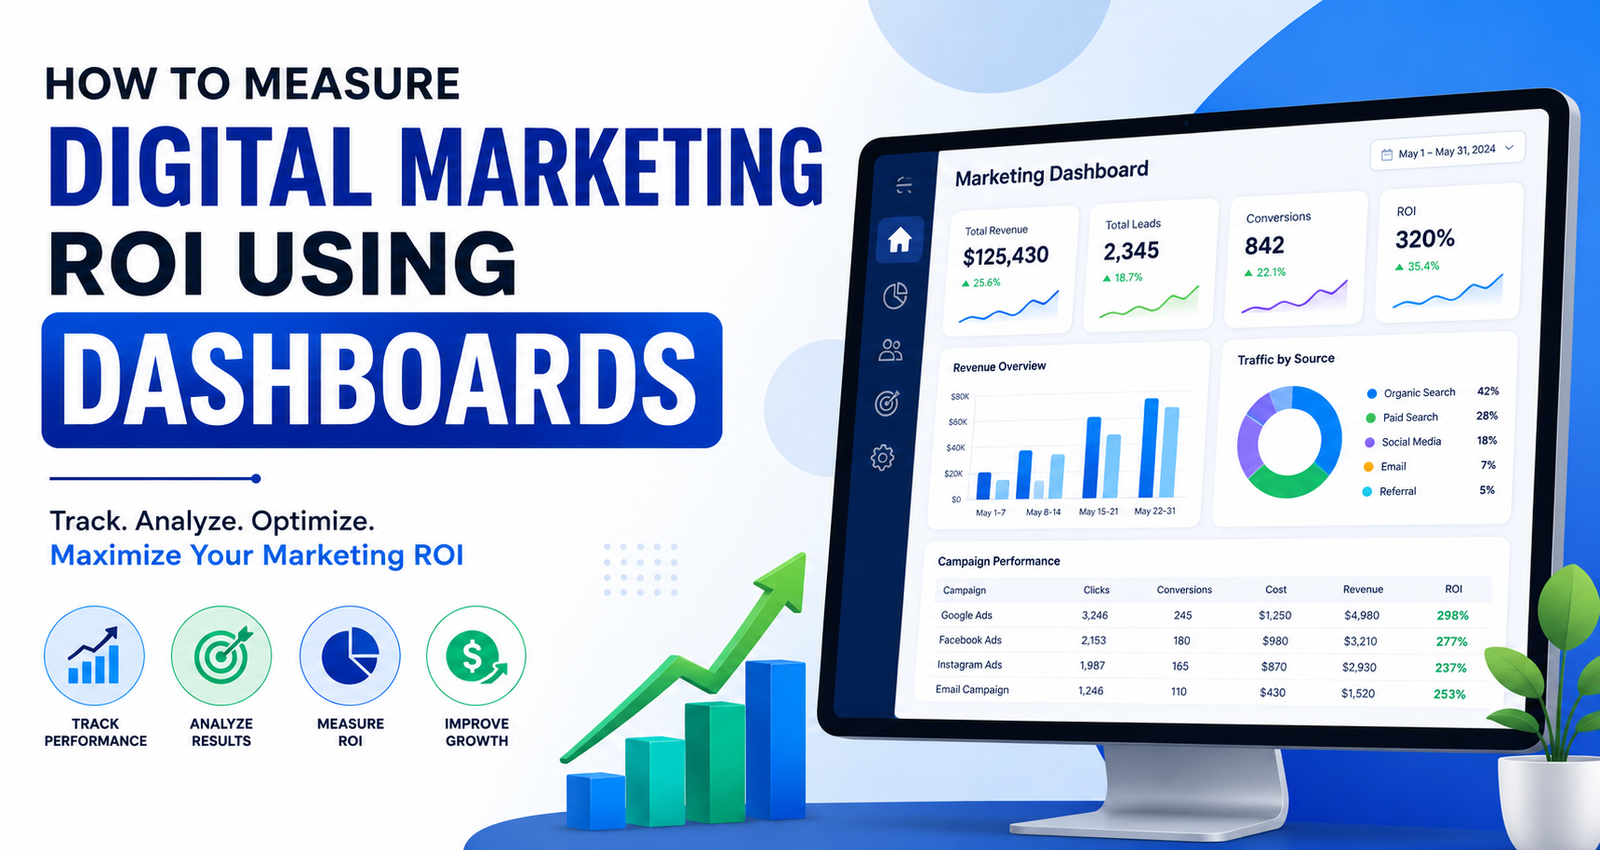
How to Measure Digital Marketing ROI Using Dashboards
How to Measure Digital Marketing ROI Using Dashboards
How to Measure Digital Marketing ROI Using Dashboards is one of the most important skills for modern marketers who want to make data-driven decisions and improve campaign performance. Businesses invest significant amounts in SEO, social media marketing, paid advertising, email marketing, and content marketing. However, without proper measurement, it becomes difficult to understand whether these efforts are generating profitable results.
A marketing dashboard helps businesses track key performance indicators (KPIs), monitor campaign performance, and evaluate return on investment (ROI) from multiple channels in one place. By using dashboards effectively, marketers can identify successful strategies, optimize underperforming campaigns, and maximize revenue.
What Is Digital Marketing ROI?
Digital Marketing ROI (Return on Investment) measures the profitability of your marketing efforts. It helps determine whether the money spent on marketing activities is generating sufficient returns.
The basic ROI formula is:
ROI = (Revenue Generated - Marketing Cost) ÷ Marketing Cost × 100
For example, if you spend ₹50,000 on a digital marketing campaign and generate ₹2,00,000 in revenue, your ROI calculation would be:
ROI = (2,00,000 - 50,000) ÷ 50,000 × 100
ROI = 300%
A positive ROI indicates successful marketing performance, while a negative ROI suggests that improvements are needed.
Why Dashboards Are Important for ROI Measurement
Many businesses collect data from different platforms such as Google Analytics, Google Ads, Meta Ads, email marketing software, and CRM systems. Managing all this information manually can be time-consuming and confusing.
Marketing dashboards simplify data analysis by combining information from multiple sources into a single visual interface.
Benefits of dashboards include:
- Real-time performance tracking
- Faster decision-making
- Better campaign optimization
- Improved reporting accuracy
- Enhanced visibility of marketing KPIs
- Better understanding of customer behavior
Dashboards allow marketing teams to quickly identify trends and take action before performance declines.
Key Metrics to Track in a Marketing Dashboard
To accurately measure digital marketing ROI, businesses should monitor several important metrics.
1. Website Traffic
Website traffic indicates how many users are visiting your website.
Important traffic metrics include:
- Total visitors
- Unique visitors
- Traffic sources
- Session duration
- Bounce rate
These metrics help determine whether your marketing campaigns are attracting relevant audiences.
2. Conversion Rate
Conversion rate measures the percentage of visitors who complete a desired action such as:
- Purchasing a product
- Filling out a form
- Downloading a resource
- Registering for a webinar
A higher conversion rate usually indicates better campaign performance.
3. Cost Per Lead (CPL)
Cost Per Lead measures the amount spent to generate a qualified lead.
Formula:
CPL = Total Campaign Cost ÷ Number of Leads
Monitoring CPL helps marketers control acquisition expenses.
4. Customer Acquisition Cost (CAC)
CAC shows the total cost required to acquire a new customer.
Formula:
CAC = Total Marketing Spend ÷ Number of New Customers
A lower CAC generally improves overall profitability.
5. Revenue Generated
Revenue is one of the most important metrics for measuring ROI.
Dashboards should display:
- Total revenue
- Revenue by channel
- Revenue by campaign
- Revenue trends over time
This helps identify the most profitable marketing channels.
Best Dashboard Tools for Measuring Marketing ROI
Several dashboard tools help businesses track performance effectively.
Google Looker Studio
Google Looker Studio provides customizable dashboards and integrates with multiple marketing platforms.
Key features:
- Free dashboard creation
- Real-time reporting
- Data visualization
- Multiple data connectors
Google Analytics
Google Analytics helps track website performance and user behavior.
It provides insights into:
- Traffic sources
- User engagement
- Conversions
- Revenue tracking
CRM Dashboards
CRM platforms help connect marketing performance with actual sales results.
Businesses can measure:
- Lead quality
- Sales pipeline performance
- Customer lifetime value
- Revenue attribution
How to Build an ROI Dashboard
Creating an effective dashboard requires proper planning.
Step 1: Define Business Goals
Start by identifying your marketing objectives.
Examples include:
- Lead generation
- Sales growth
- Brand awareness
- Website traffic improvement
Your dashboard should align with these goals.
Step 2: Select Relevant KPIs
Choose metrics that directly impact business outcomes.
Avoid tracking unnecessary data that does not support decision-making.
Step 3: Integrate Data Sources
Connect platforms such as:
- Google Analytics
- Google Ads
- Meta Ads
- Email Marketing Tools
- CRM Software
This ensures accurate reporting across all channels.
Step 4: Create Visual Reports
Use charts, graphs, and scorecards to present data clearly.
Visual reporting makes it easier to identify trends and opportunities.
Step 5: Monitor and Optimize
Review dashboard data regularly and make strategic adjustments based on performance insights.
Continuous optimization improves marketing effectiveness and ROI
Leave a Comment