
- info@service.digitalmarketingvidyapeeth.com
support@service.digitalmarketingvidyapeeth.com - Pioneer Residential Campus for NDA, Near Khandoba Temple, Raywadi road, Loni Kalbhor, Maharashtra 412201

Blog Details
15
Jul
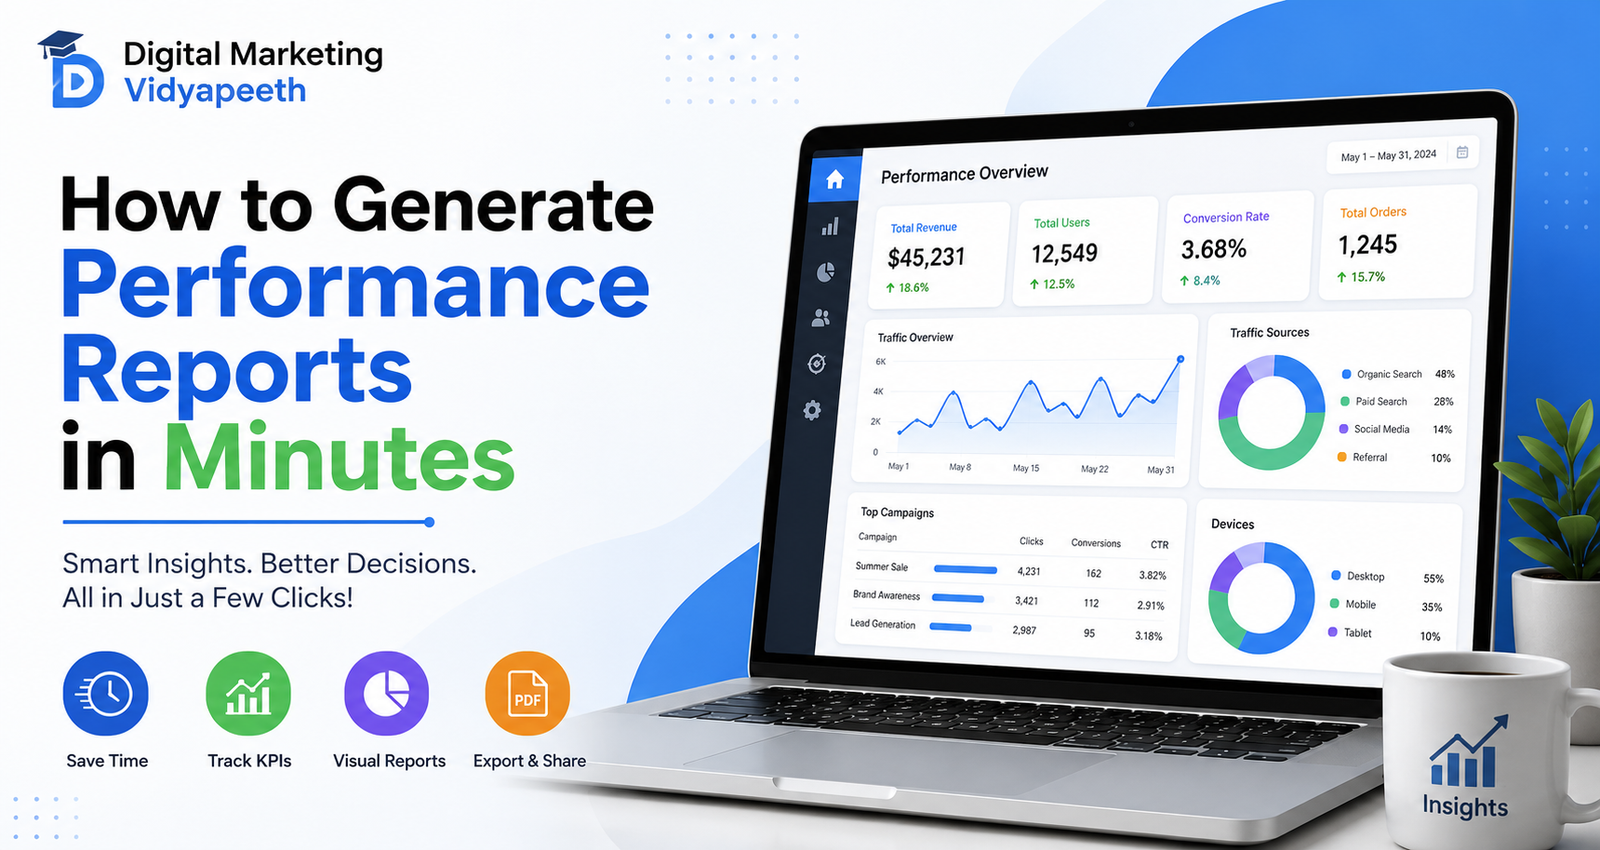
How to Generate Performance Reports in Minutes
How to Generate Performance Reports in Minutes: A Complete Guide
Performance reports play a crucial role in measuring business success. Whether you're managing marketing campaigns, tracking sales, or monitoring employee productivity, creating accurate reports quickly helps businesses make better decisions. How to Generate Performance Reports in Minutes is no longer a challenge when you use the right reporting dashboard and automation tools.
Instead of spending hours collecting data from multiple sources, modern dashboards allow you to generate reports instantly with just a few clicks. In this guide, you'll learn how to create professional performance reports in minutes while improving accuracy, saving time, and making data-driven decisions.
Why Performance Reports Matter
Performance reports help businesses understand what's working and what needs improvement. They transform raw data into meaningful insights that support smarter business decisions.
A good performance report helps you:
-
Track KPIs in real time
-
Monitor campaign performance
-
Analyze employee productivity
-
Measure ROI
-
Improve decision-making
-
Identify growth opportunities
-
Save reporting time
Without proper reporting, businesses often rely on guesswork instead of actual performance data.
Common Problems with Manual Reporting
Many organizations still generate reports manually using spreadsheets. While this method works, it creates several challenges.
Time-Consuming Process
Collecting information from different platforms takes hours.
Human Errors
Manual copying increases the chances of mistakes.
Delayed Decisions
By the time reports are ready, the data may already be outdated.
Poor Visualization
Simple spreadsheets often fail to present insights clearly.
This is why businesses are switching to automated reporting dashboards.
Benefits of Automated Performance Reports
Automated dashboards simplify reporting by gathering information from multiple sources and displaying it in one place.
Save Hours Every Week
Reports can be generated in seconds instead of hours.
Real-Time Data
Always work with the latest information.
Better Accuracy
Automation reduces manual calculation errors.
Professional Visual Reports
Charts, graphs, and dashboards make reports easier to understand.
Easy Sharing
Export reports as PDF, Excel, or share dashboard links instantly.
Steps to Generate Performance Reports in Minutes
1: Connect Your Data Sources
Integrate platforms like:
-
Google Analytics
-
Google Ads
-
Meta Ads
-
CRM
-
Sales Software
-
Website Analytics
-
Excel Sheets
Connecting all sources allows the dashboard to collect data automatically.
2: Select KPIs
Choose metrics based on your business goals.
Examples include:
-
Website Traffic
-
Leads Generated
-
Sales Revenue
-
Conversion Rate
-
Cost Per Lead
-
Return on Investment
-
Customer Acquisition Cost
Avoid tracking unnecessary metrics.
3: Use Dashboard Templates
Modern dashboards include ready-made templates for:
-
Marketing Reports
-
Sales Reports
-
SEO Reports
-
Social Media Reports
-
Lead Generation Reports
-
Business Performance Reports
Templates save significant reporting time.
4: Customize the Report
Include only relevant information such as:
-
Date Range
-
Campaign Performance
-
Revenue
-
Lead Sources
-
Team Performance
-
Traffic Trends
-
Goal Progress
Customization makes reports easier for clients and management to understand.
5: Generate the Report
After selecting the required filters, simply click Generate Report.
Within minutes, you'll receive:
-
Visual Dashboard
-
PDF Report
-
Excel Report
-
Printable Report
Essential Metrics to Include
Every business should monitor key performance indicators.
Marketing Metrics
-
Website Visitors
-
Click-Through Rate
-
Cost Per Click
-
Conversion Rate
-
Bounce Rate
Sales Metrics
-
Revenue
-
Sales Growth
-
Customer Retention
-
Average Order Value
Social Media Metrics
-
Reach
-
Impressions
-
Engagement
-
Followers Growth
-
Video Views
SEO Metrics
-
Organic Traffic
-
Keyword Rankings
-
Backlinks
-
Page Speed
Best Practices for Faster Reporting
Keep Dashboards Organized
Arrange widgets logically for easier analysis.
Automate Data Refresh
Enable automatic syncing to avoid outdated reports.
Use Visual Charts
Graphs communicate trends faster than large tables.
Schedule Reports
Automatically send reports daily, weekly, or monthly.
Monitor KPIs Regularly
Review reports consistently to identify improvements early.
Industries That Benefit from Performance Reporting
Almost every industry can benefit from automated reporting dashboards.
Examples include:
-
Digital Marketing Agencies
-
Educational Institutes
-
Healthcare
-
Real Estate
-
E-commerce
-
Manufacturing
-
Finance
-
Retail
-
IT Companies
-
Consulting Firms
Each industry uses reports differently, but the goal remains the same—better decision-making.
Common Mistakes to Avoid
Many businesses reduce the effectiveness of reports by making these mistakes:
-
Tracking too many KPIs
-
Using outdated data
-
Ignoring trends
-
Creating overly complex dashboards
-
Not reviewing reports regularly
-
Failing to automate reporting
Keeping reports simple and focused improves decision-making.
How Dashboards Improve Business Performance
A modern dashboard provides:
-
Real-time insights
-
Automated calculations
-
Better forecasting
-
Faster reporting
-
Team collaboration
-
Higher productivity
Managers spend less time preparing reports and more time improving business performance.
Leave a Comment